Skip to content
How we help
Investors
Best-in-class, real-time data and expert analyses designed to give you an edge in alpha generation.
Learn More
Companies
Real-time customer behavior, performance benchmarking, and market insights from investment-grade data and expert analysts.
Learn More
Consultants
Get visibility into thousands of consumer and healthcare companies across hundreds of sectors.
Learn More
Our Data
Insights
About Us
Our Company
Press
Careers
Login
Start for free
Earnest Insights
Our team's latest data-driven research
Unique perspectives on the retail, restaurant, healthcare, and tech landscapes
Home Furnishing, Footwear benefit most from tax refund spending in 2024
Guitar Center set to gain customers as Sam Ash closes locations
California wage law resulting in rising average ticket, declining transactions
Flowers, DTC set to benefit most during Mother’s Day
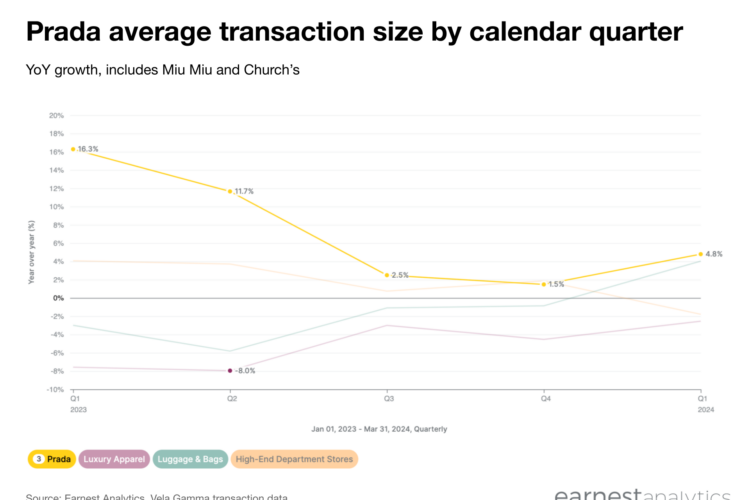
Prada DTC outperforms luxury, department stores on ticket increase
Ask the Experts: Competitive Benchmarking Powered by CLV Ultra, Applied to Temu
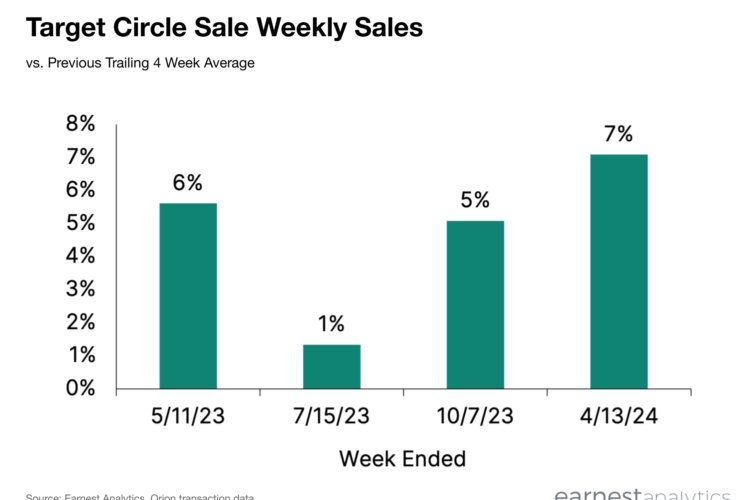
Target’s April 2024 Circle Sale was its largest by sales lift
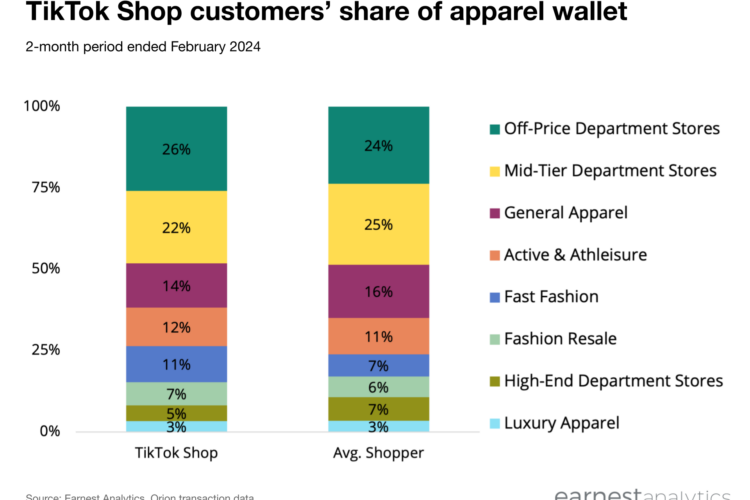
TikTok Shop customers spend more at lower ticket apparel retailers
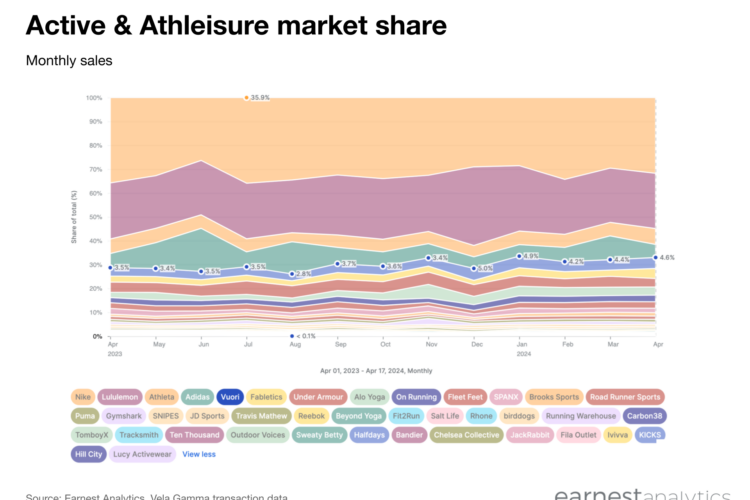
Athleisure shoppers lean into Vuori, Alo Yoga
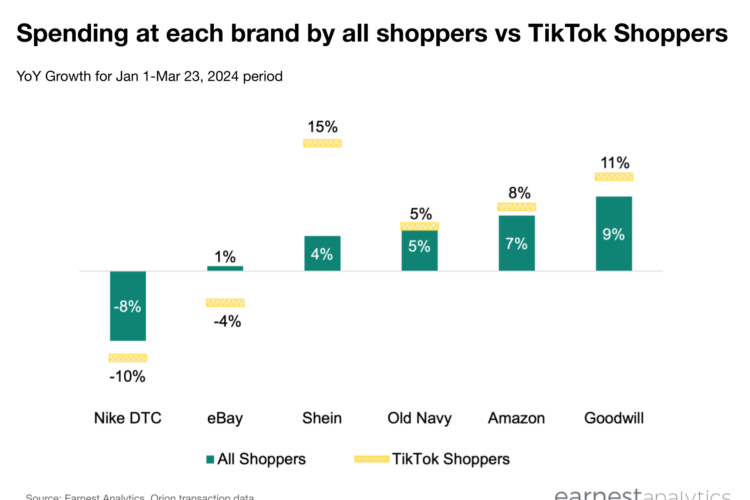
TikTok shoppers outspent at Shein, underspent at Nike
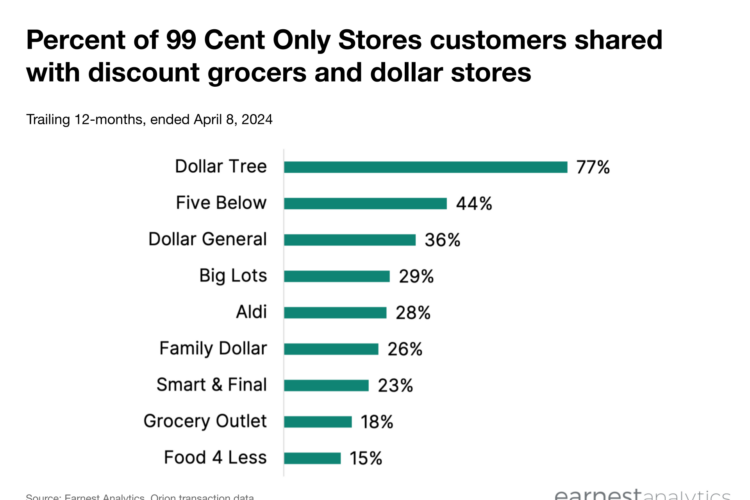
99 Cent Only Store closings to benefit Dollar Tree, other discounters
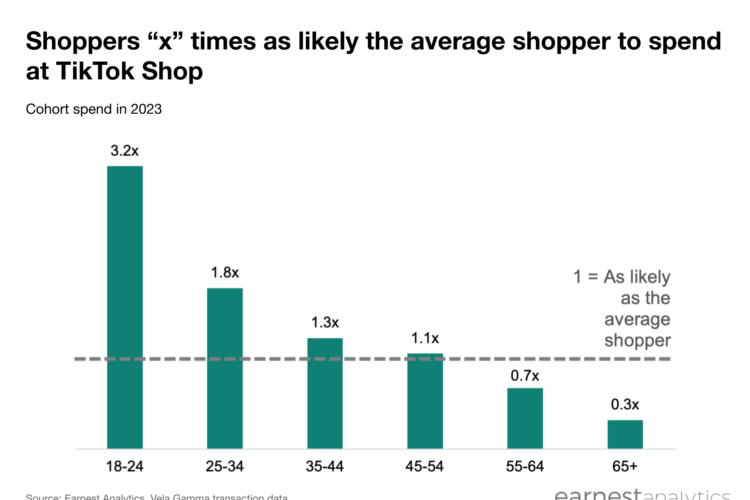
TikTok Shop customers skew young, but not just Gen Z
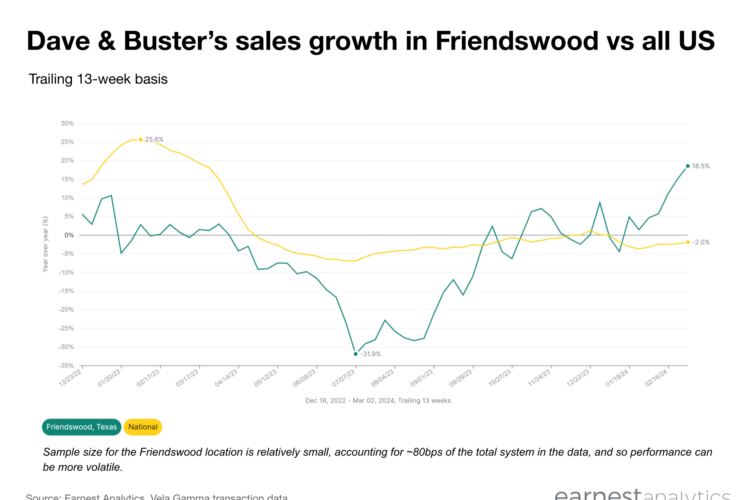
Dave & Buster’s remodeled Friendswood store format outperforming
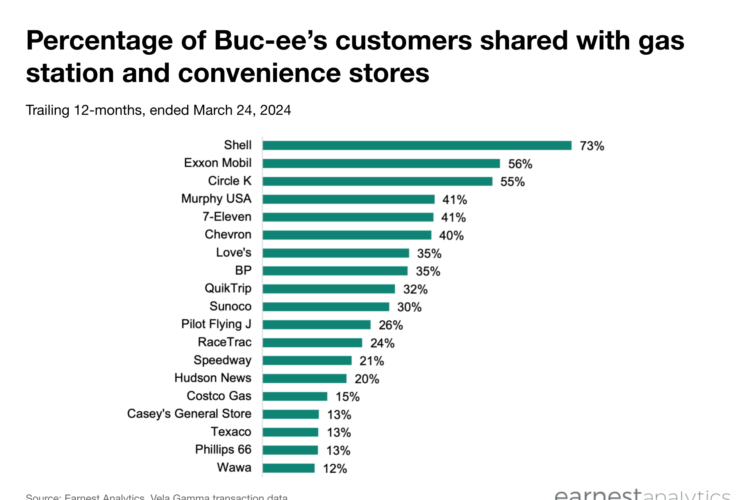
Buc-ee’s expansion could have highest impact on Shell, Exxon Mobil, and Circle...
How Earnest AI revolutionizes investing with third party data
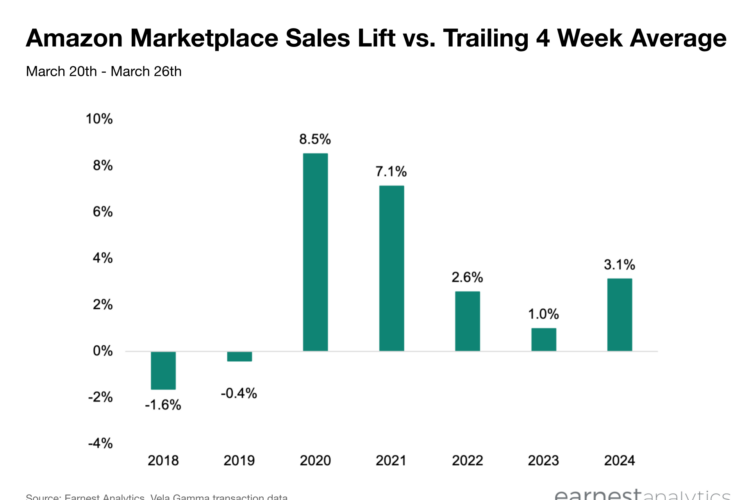
Amazon’s first Big Spring Sale, early Easter provide a slight lift in...
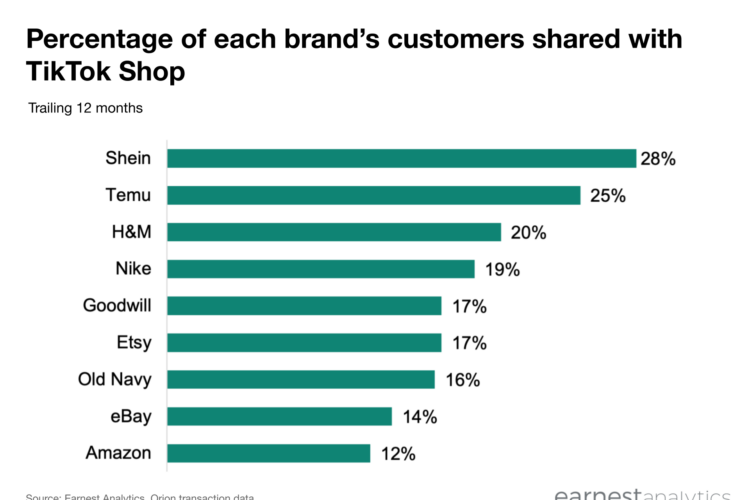
Shein, Temu share highest percentage of customers with TikTok Shop
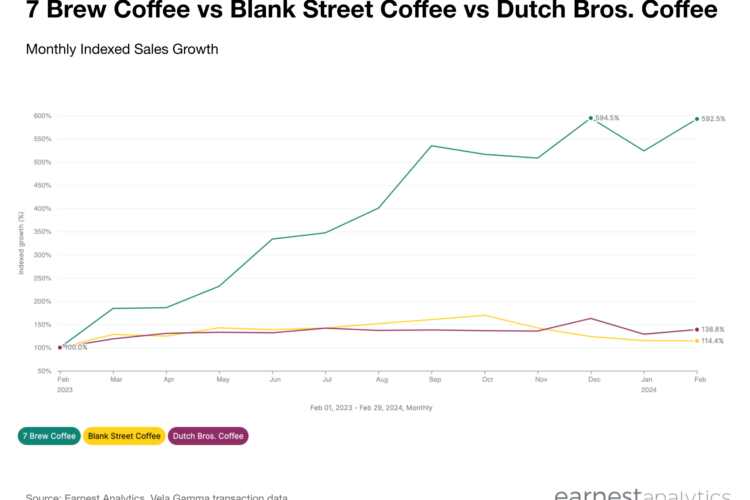
Brewing up a storm: 7 Brew Coffee, Dutch Bros. challenge incumbents
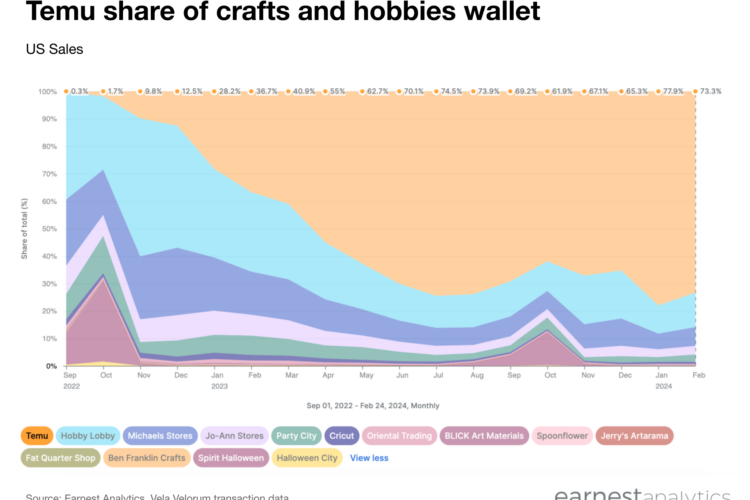
Hobby and party supplies in an era of Temu
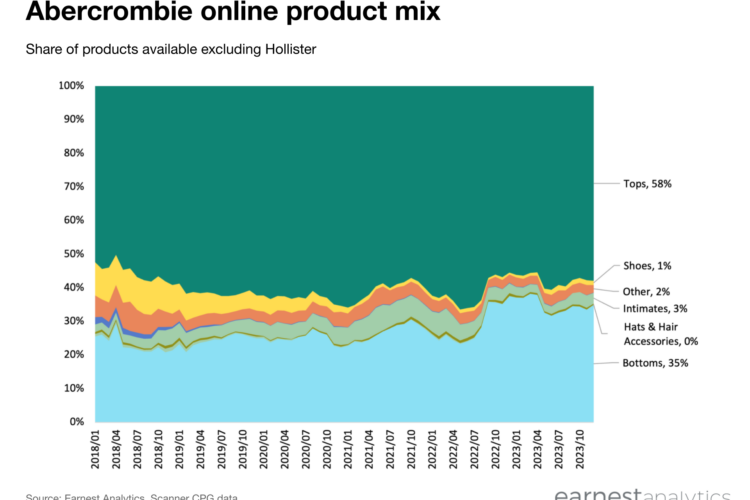
Abercrombie’s growth led by 25-34 year old shoppers, pants
1
2
3
4
5
…
19
»
How we help
Investors
Companies
Consultants
Our Data
Insights
About Us
Our Company
Press
Careers
Login
Start for free
arrow-down
caret-down-menu
caret-down
check
close
facebook-square
filter
hamburger
instagram-square
linkedin-square
mobile-parent-indicator
pause
play
twitter-square